Free phone within New Zealand: 0800 123 733
Email: [email protected]
ETS Case Studies
 Case Study Summary
These case studies are currently under review to match the new agriculture regulations. If you wish to do some calculations yourself please use our calculators here.
The table below is a summary of the case studies undertaken on 4 typical farming situations. For more information on these case studies please see Info Sheets 8, 9, 10 and 11 which can be found at the Articles page here.
| Farm Type | Area (ha) | Herd No.s | Total Emissions (NZU /yr) |
Obligations at 2015 |
|
|
Example 1 |
|||||
| Example 2 | |||||
| Example 3 |
|||||
| Example 4 |
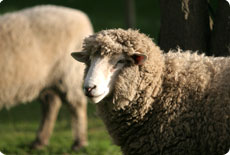
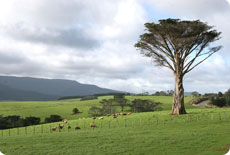
Example 1 – Sheep and Beef
The total annual "carbon footprint" for this example is xxx NZU's.
| Unit | No. | NZU | |
| Petrol | Litres | 2,540 | |
| Diesel | Litres | 52 | |
| Electricity | kWhr | 19,660 | |
| Nitrogen | Tons | 8 | |
| Cattle | Cattle | 469 | |
| Sheep | Ewes | 2,862 | |
Total |
Agriculture will be included in the
Emissions Trading Scheme from 2015. Initially there will be a 90% allocation of credits which means
that farmers will be liable for 10% of their livestock emissions (energy and fertiliser will be paid
separately). This amounts to 175 NZUs in 2015 for this farm. At present the meat processor will pay
this on behalf of the farmer. At $25/NZU this will amount to a levy of about 3c/kg beef and 6c per
kg sheepmeat. The free allocation of credits will reduce by 1.3% year on year from 2016 onwards.
For more information for this case study see Info Sheet 8 here.
Example 2 – Dairy
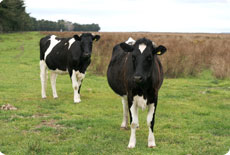
The total annual "carbon footprint" for this example is xxx NZU's.
| Unit | No. | NZU | |
| Petrol | Litres | 1,500 | |
| Diesel | Litres | 11,000 | |
| Electricity | kWhr | 62,240 | |
| Nitrogen | Tons | 39 | |
| Cows | 535 | ||
| Heifers | 260 | ||
| Total |
Agriculture will be included in the Emissions Trading Scheme from 2015. Initially there will be a 90% free allocation of credits which means that farmers will be liable for 10% of their livestock emissions (energy and fertiliser will be paid separately). This amounts to 166 NZUs in 2015 for this farm. At present the milk processor will pay this on behalf of the farmer, at $25/NZU this will amount to a levy of about 2.5c/kg milk solids. The free allocation will reduce by 1.3% per year on year from 2016 onwards. For more information for this case study see Info Sheet 9 here.
Example 3 – Arable 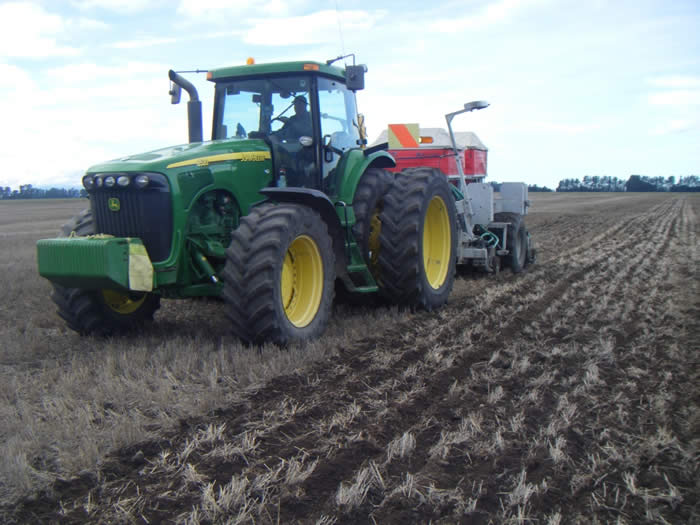
The total annual "carbon footprint" for this example is xxx NZU's.
| Unit | No. | NZU | |
| Petrol | Litres | 4,922 | |
| Diesel | Litres | 18,190 | |
| Electricity | kWhr | 428,000 | |
| Nitrogen | Tons | 28 | |
| Sheep | Ewes | 860 | |
| Total |
Agriculture will
be included in the Emissions Trading Scheme from 2015. Initially there will be a 90% free allocation of credits
which means that farmers will be liable for 10% of their livestock emissions (energy and fertiliser will be paid
separately). This amounts to 29 NZUs in 2015 for this farm. At present the meat processor will pay this on
behalf of the farmer, at $25/NZU this will amount to a levy of about 6c/kg sheepmeat. The free allocation will
reduce by 1.3% per year on year from 2016 onwards. For more information for this case study see Info Sheet 11 here.
 Example 4 - Dairy, Sheep and Beef
The total annual "carbon footprint" for this example is xxx NZU's.
| Unit | No. | NZU | |
| Petrol | Litres | 2,300 | |
| Diesel | Litres | 12,500 | |
| Electricity | kWhr | 63,848 | |
| Nitrogen | Tons | 45 | |
| Dairy | Cows | 535 | |
| Cattle | Cattle | 550 | |
| Dairy | Heifers | 150 | |
| Sheep | Ewes | 1,300 | |
| Total |
Agriculture will be included in the Emissions Trading Scheme from 2015. Initially there will be a 90% free allocation of credits which means that farmers will be liable for 10% of their livestock emissions (energy and fertiliser will be paid separately). This amounts to 288 NZUs in 2015 for this farm. At present milk and meat processors will pay this on behalf of the farmer. At $25/NZU this will amount to a levy of about 3c/kg beef, 6c per kg sheepmeat and 2.5c/kg milk solids. The free allocation will reduce by 1.3% per year on year from 2016 onwards. For more information for this case study see Info Sheet 10 here.